Something Broke Your Delta Table. The Delta Log Knows What.
DESCRIBE HISTORY. Drop down to raw commit JSON in _delta_log only for file-level detail, and remember that time travel can fail even when the log still lists the version you want, because VACUUM may already have removed the data files. Most write conflicts trace back to partitioning or metadata changes. On Unity Catalog managed tables with catalog commits, the catalog decides what the latest version is, not the folder.It's Monday morning. A gold table lost 40% of its rows overnight, the dashboard built on it is already wrong, and nobody in the team channel is owning up.
Before you open a ticket or start guessing, check the delta log. Every change to that table, including who made it, which operation it was and how many rows it touched, was written down the moment it happened.
The delta log is the _delta_log folder sitting next to your Parquet files. Most of us learn it as theory: JSON commits, checkpoints, ACID. That's useful, but it's not what you need at 9am with a broken table.
So let's chat about the delta log as a debugging tool. What's in it, where to look first, why time travel sometimes lies to you, and what changes now that Unity Catalog can coordinate commits instead of the folder.
What's actually inside the delta log?
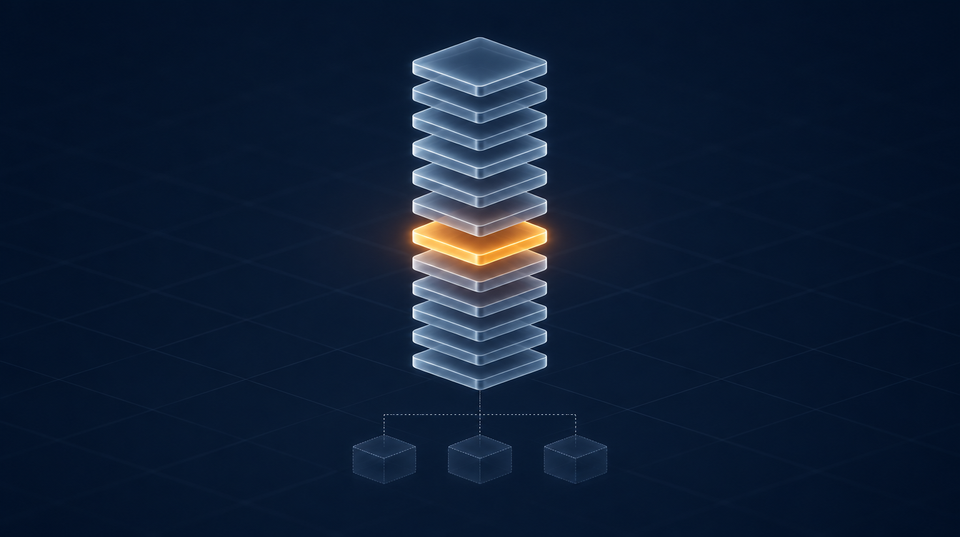
The delta log is a folder of ordered commit files. Each one is a JSON file holding the actions for a single table version. Every so often a Parquet checkpoint snapshots the full table state, so readers don't have to replay everything. A table's current state is simply the result of applying those commits in order.
Commit files and the actions inside them
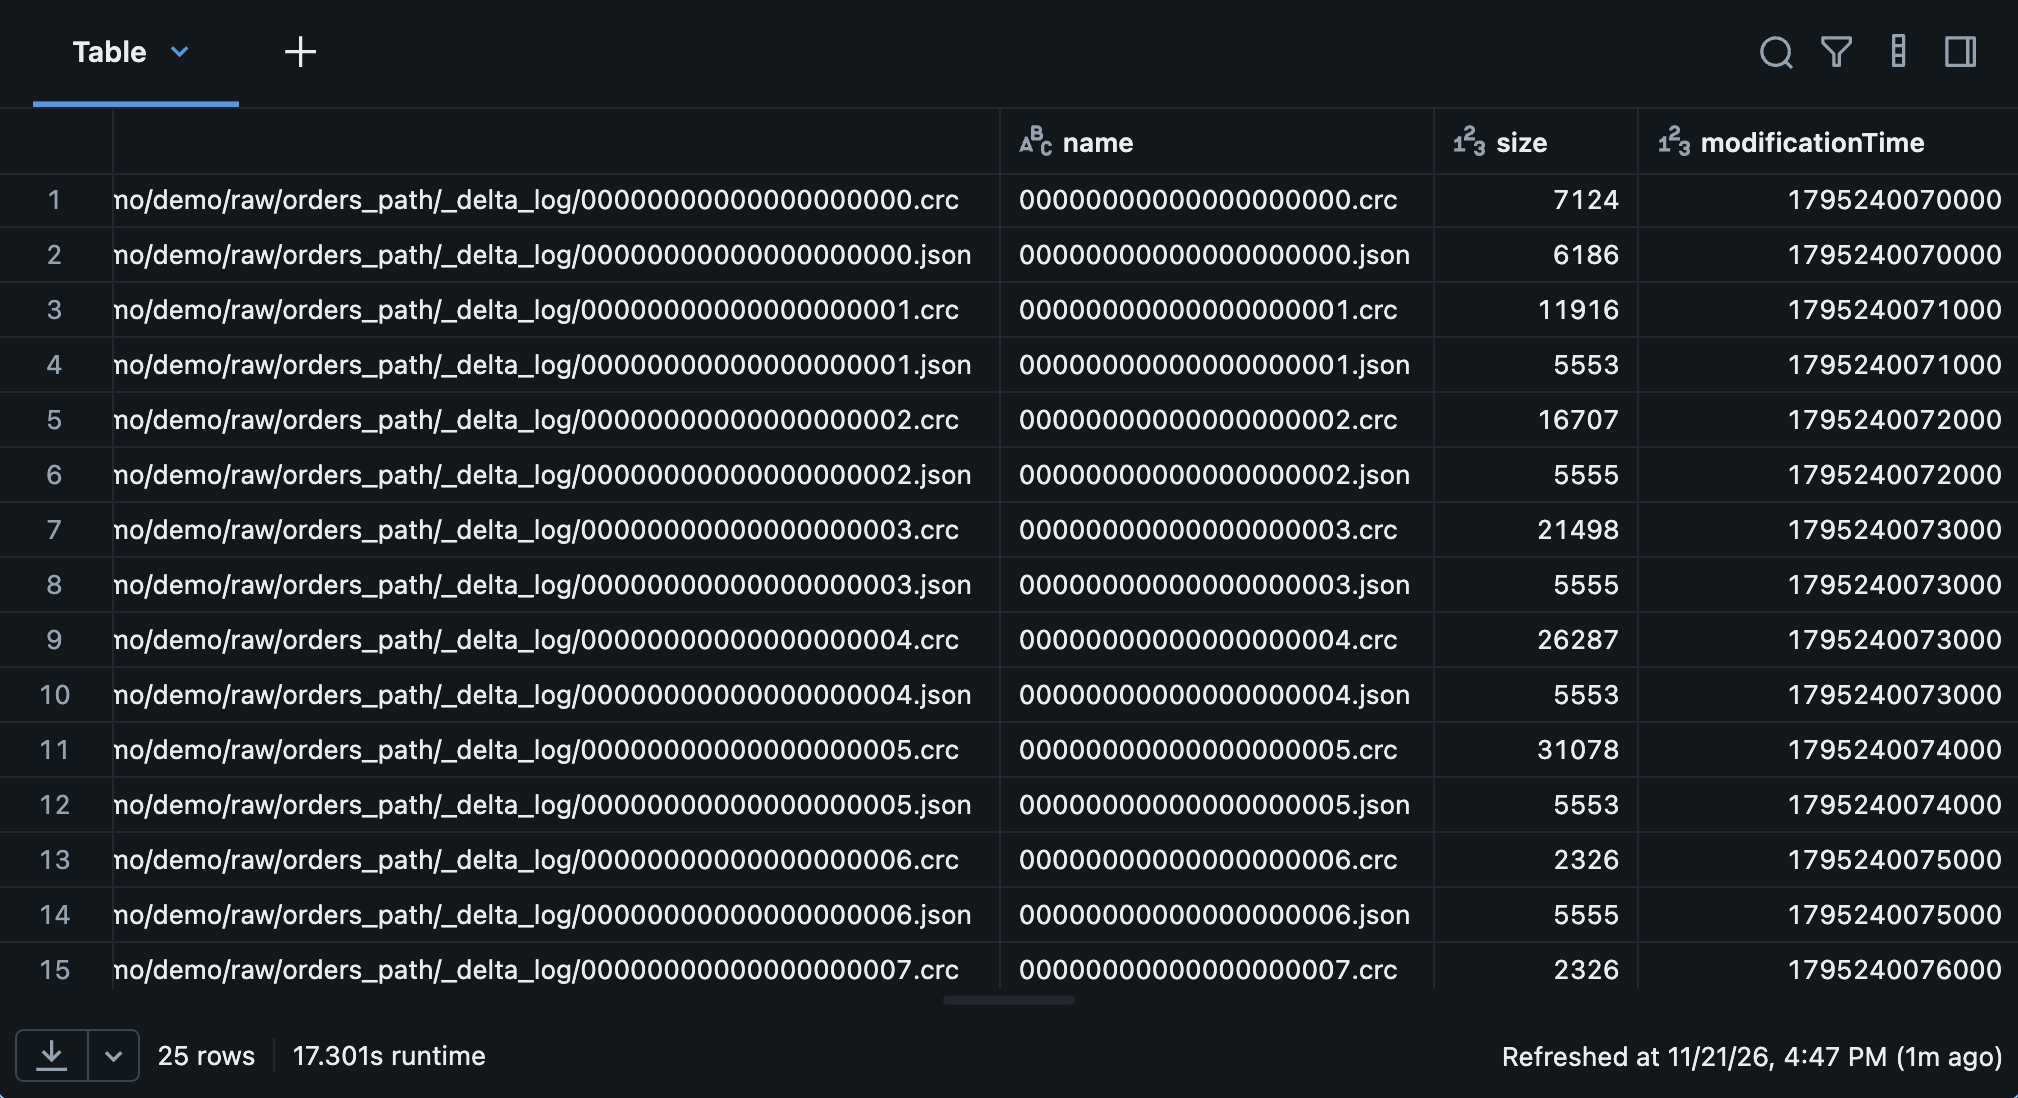
Each write produces one commit file, named after its version and zero-padded to 20 digits (00000000000000000042.json). Inside are actions: add and remove for data files, metaData for schema and table properties, protocol for the reader and writer versions required, commitInfo for who did what, and txn for idempotent streaming writes. Conduktor's glossary entry gives a good breakdown of each log action, including the per-file min/max stats on add that power data skipping.
The rule that matters, from Databricks' original walkthrough of the transaction log: "if it's not recorded in the transaction log, it never happened." A Parquet file sitting in the folder isn't part of your table unless an add says so.
.crc files.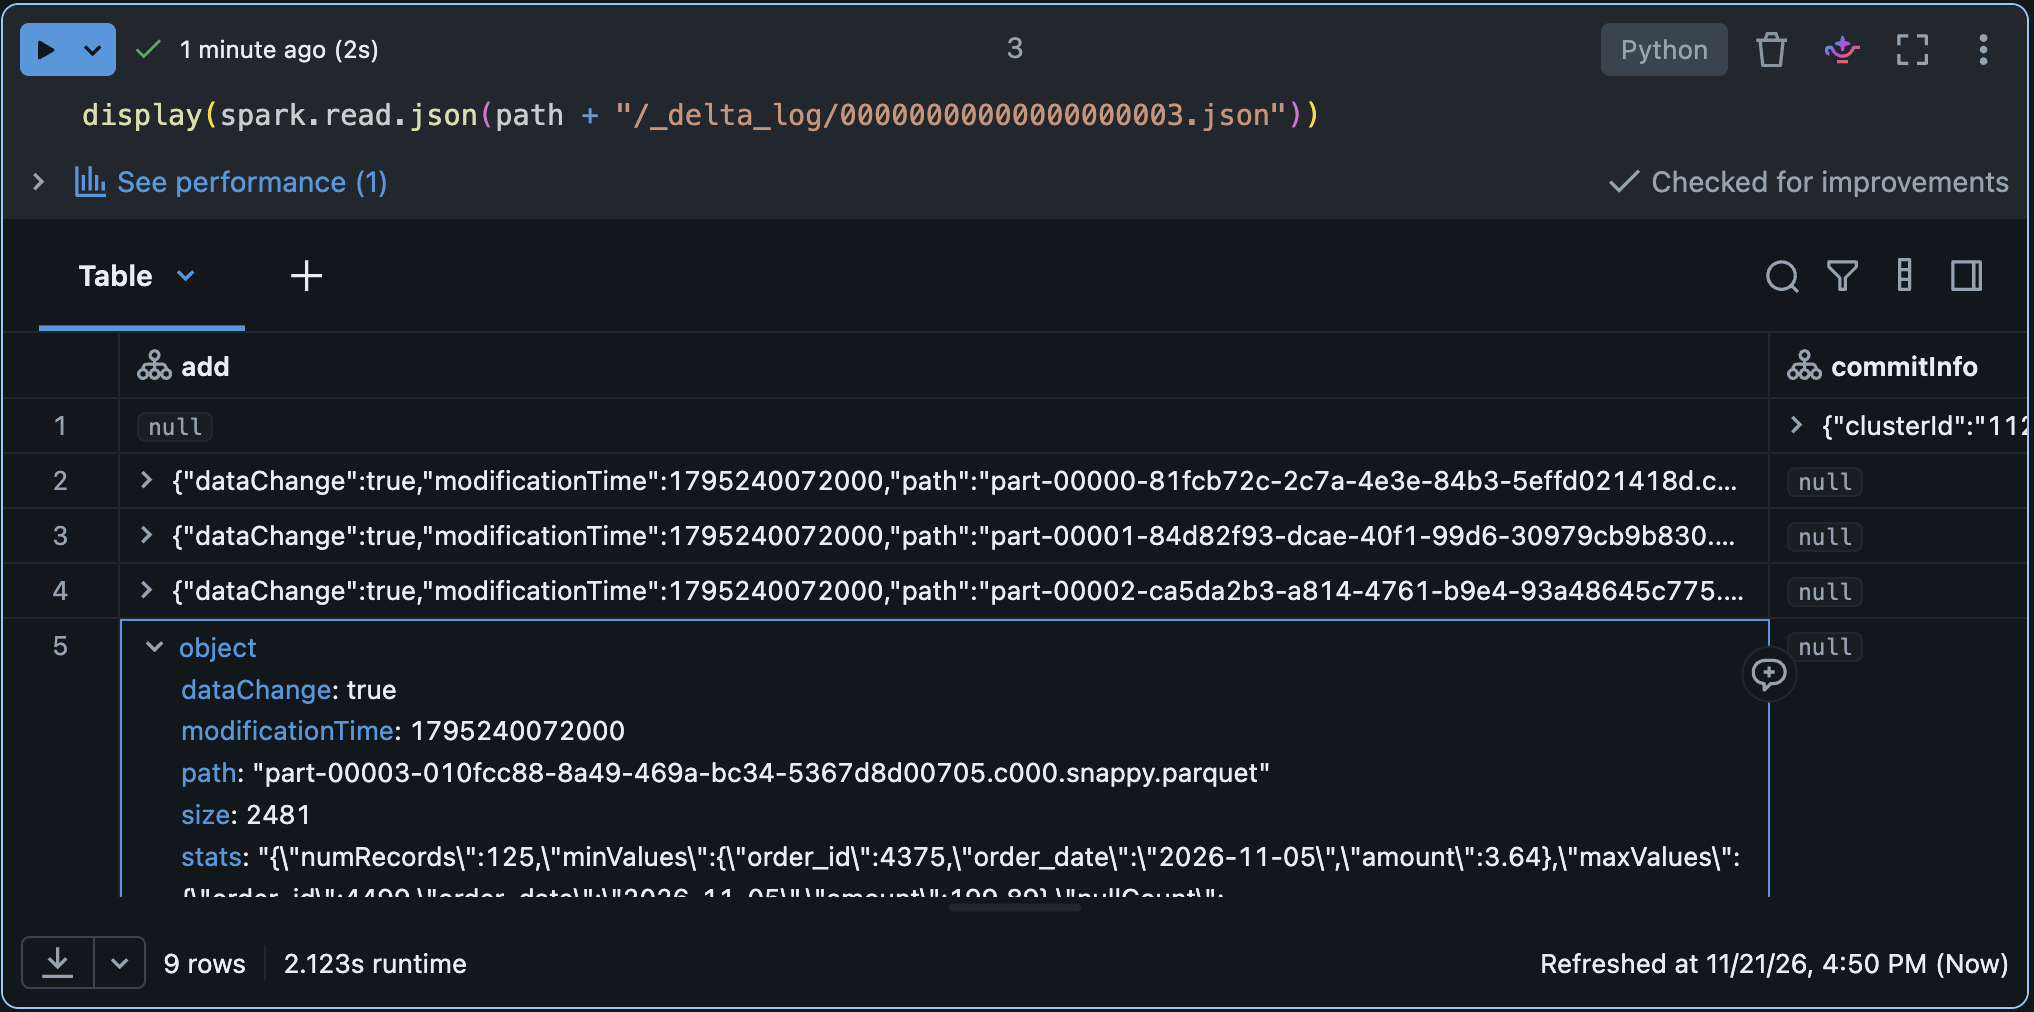
Checkpoints, _last_checkpoint and V2 sidecars
Replaying thousands of JSON files gets slow, so Delta periodically writes a Parquet checkpoint. How often is where most guides are out of date. Open-source Delta defaults to every 10 commits, but on Databricks newer tables checkpoint every 100 commits unless you set delta.checkpointInterval yourself.
So if you count ten commits and see no checkpoint, nothing is broken. A small _last_checkpoint file points readers straight to the newest one, so they don't have to list the whole folder.
The Delta protocol spec also defines V2 checkpoints. These are UUID-named and can split file actions into sidecar files under _delta_log/_sidecars. If you see that folder, you're on V2.
The .crc files nobody asks about
You'll also see .crc files next to the commits. These are version checksums: a small summary of the table's state at that version, such as size and file count. They're optional, so a table can be perfectly healthy without them.
Why start with DESCRIBE HISTORY and not the JSON files?
DESCRIBE HISTORY reads the delta log for you and returns one row per version, showing the operation, the user, the parameters and the row-level metrics. It answers "who did what, and when" in a single query. Raw commit JSON is the next step, for when you need to see the exact files that were added or removed.
What history answers
Run DESCRIBE HISTORY my_table LIMIT 20 and scan the operation column. Truth be told, that column alone solves a lot of mysteries. A MERGE at 2am from a job you forgot existed. A CREATE OR REPLACE TABLE that someone ran from a notebook "just to test something".
Then look at the columns that matter for debugging. userName and job tell you who or what ran it.
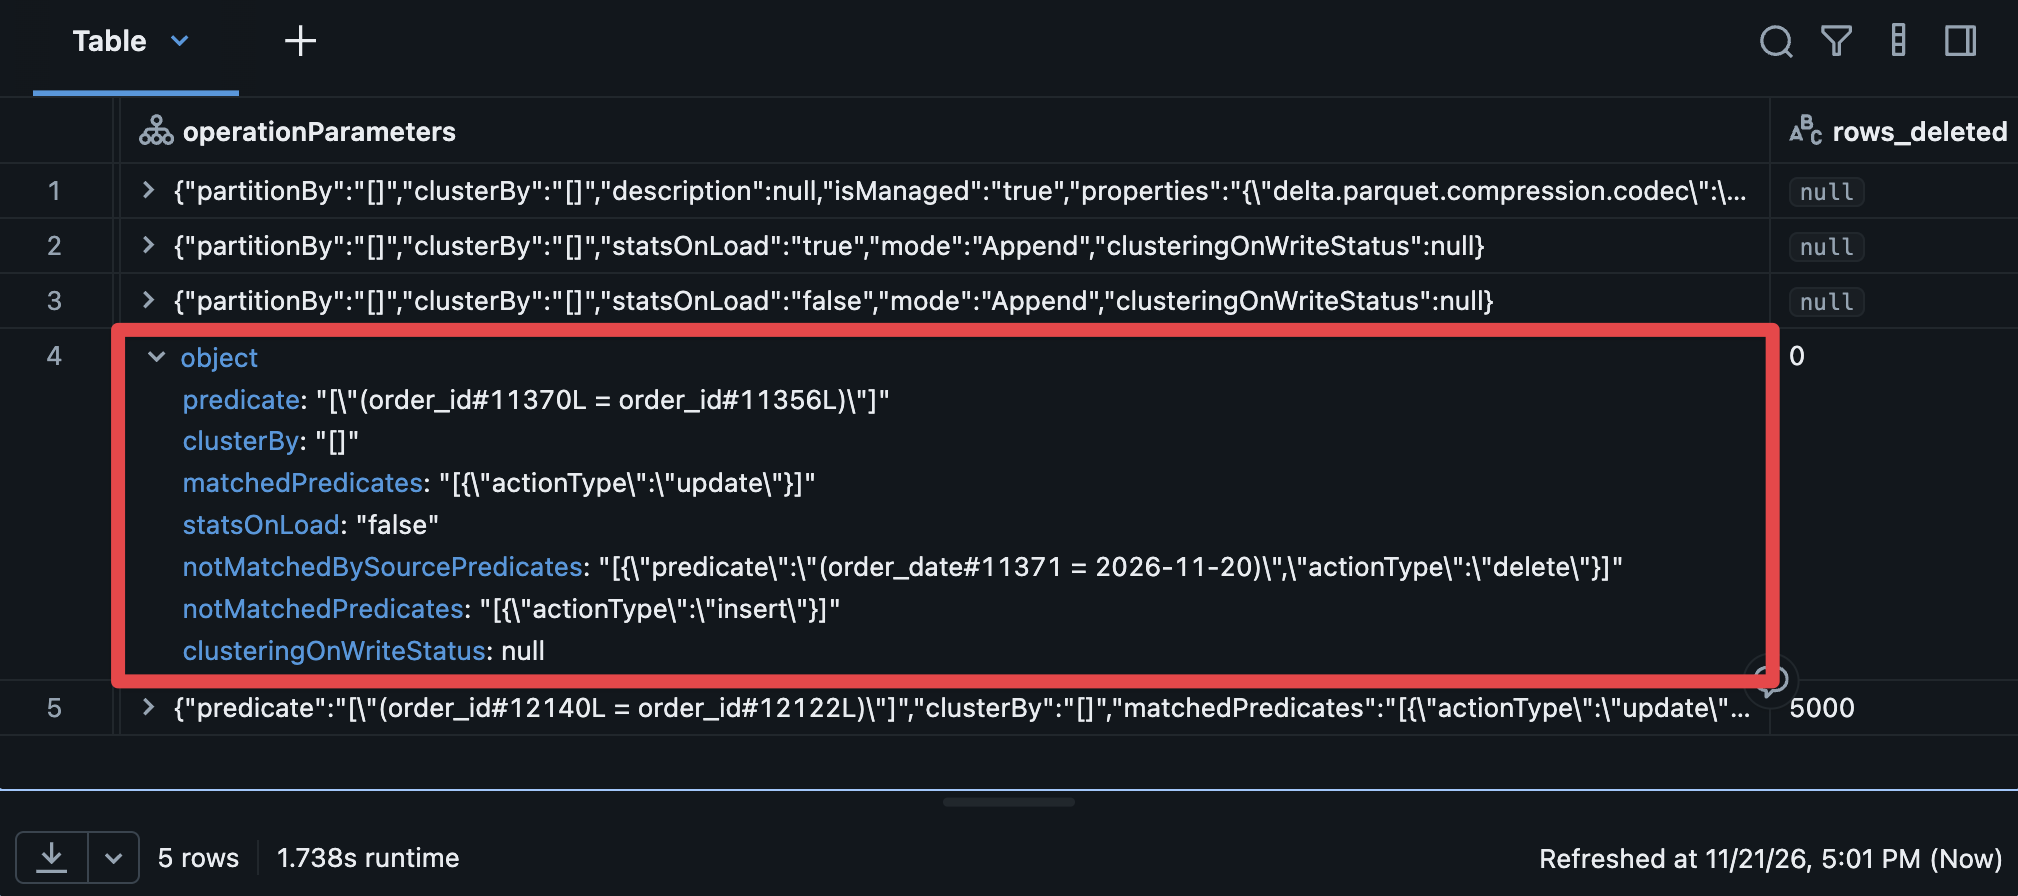
operationParameters shows the predicate or merge condition. operationMetrics gives row counts, such as numTargetRowsDeleted on a MERGE or numDeletedRows on a DELETE. Databricks' docs on table history and time travel cover the full schema.
When to drop down to raw commit files
Sometimes you need more than counts: you need the files. On a table you can reach by path, read a single commit directly:
commit = spark.read.json("<table_path>/_delta_log/00000000000000000042.json")
commit.select("add.path", "remove.path", "commitInfo.operationParameters").show(truncate=False)
That tells you exactly which files a version added and removed. It's rarely the first step, but it's the one that settles arguments.
"Who deleted my rows?" Tracing a bad write
Here's an illustrative example, not a real incident. A nightly MERGE upserts orders into a gold table. Someone "simplifies" the merge condition and drops the date predicate.
The job succeeds. The row count halves.
The pipeline is green, monitoring is quiet, and the business finds out first. I'd call that the green-pipeline lie: a successful run tells you the job finished, not that it did the right thing.
Find the version, then read it
Run DESCRIBE HISTORY, look for the first version where operationMetrics shows a deletion count that doesn't match normal days, and note its version and readVersion. Compare its operationParameters with the previous night's run. In this example, the missing predicate is sitting right there in the merge condition.
If the counts look fine but the data doesn't, read that version's commit file. A large number of remove actions, paired with add actions for smaller files, usually means rows were rewritten or dropped at scale.
Fix it
You have two options. RESTORE TABLE orders_gold TO VERSION AS OF 41 rolls the whole table back. That's clean, but it also discards any good writes made after version 41.
The more surgical option is to re-insert only what was lost: select from orders_gold VERSION AS OF 41 the rows that no longer exist in the current version. This keeps later writes intact. Then fix the MERGE, because otherwise you'll be doing this again tomorrow.
The whole investigate-and-fix loop takes under a minute when you know where to look.
Why does time travel fail when the delta log still shows the version?
Two separate clocks are running. The delta log keeps history for logRetentionDuration, which is 30 days by default. VACUUM deletes unreferenced data files once they're older than deletedFileRetentionDuration, which is 7 days by default. So history can show a version whose data files are already gone.
I call this the ghost version. DESCRIBE HISTORY happily lists version 312 from three weeks ago. You try VERSION AS OF 312, and the query fails because the Parquet files it points to were vacuumed a fortnight ago.
The two retention settings, and what changed in DBR 18
According to Databricks' retention rules for time travel, if you run VACUUM daily on the defaults, about 7 days of data is actually available to time travel. In Databricks Runtime 18.0 and above, time travel queries older than deletedFileRetentionDuration are blocked outright, and logRetentionDuration has to be at least as long as deletedFileRetentionDuration. For Unity Catalog managed tables, this applies from DBR 12.2.
That's a good change. A clear "blocked" error beats a confusing "file not found" every time.
In a project I built testing six Delta optimisation techniques, VACUUM's 7-day retention check turned out to be the one guardrail you can't switch off on serverless. I found that annoying at the time. In hindsight, it's the reason nobody can quietly vacuum away last Tuesday.
The delta log kept the record of version 1, but its data is gone or out of bounds. That's the ghost version. If you genuinely need 30 days of time travel, set both properties to 30 days, and remember that history isn't a backup strategy.
If you genuinely need 30 days
Set both properties together, for example delta.deletedFileRetentionDuration = 'interval 30 days' alongside the 30-day log default. That means more storage, because you're keeping old files for longer. Don't treat time travel as a backup either: Databricks itself recommends against using table history for long-term archival.
What is the log telling you when writes conflict?
Delta uses optimistic concurrency. Each writer reads a version, does its work, then tries to commit the next version number. Only one writer can claim that number. The loser checks whether anything it read has changed: if not, it retries; if so, it fails with a conflict exception.
What the exceptions really mean
Databricks' original walkthrough shows two writers racing for the same commit number. One wins, and the other retries as the next version without reprocessing its data. A conflict only becomes an error when the retry can't be reconciled.
ConcurrentAppendException usually means another writer added files to data your operation read, such as two MERGE jobs hitting the same partition. Blind appends generally don't conflict under the default WriteSerializable isolation level. The write-conflict matrix lists which pairs of operations can collide.
Optimistic concurrency is real, and you can watch the losing writer fail.
Row-level concurrency, and the ALTER TABLE problem
Without row-level concurrency, two jobs that change different rows in the same file can still collide. Row-level concurrency resolves many of those conflicts automatically. It needs deletion vectors and no partitioning, and tables with liquid clustering get it by default.
The conflict that catches people out is metadata. A schema change, a protocol upgrade or an ALTER TABLE ... SET TBLPROPERTIES can fail every concurrent write, including plain inserts. If your conflicts spike at the same time every week, check whether someone's maintenance job is altering the table mid-load.
When the delta log itself is the slow part
Sure, the delta log is metadata, and metadata is small. Until it isn't.
A streaming job committing every few seconds produces thousands of tiny commits a day. Each one is a file in _delta_log, and readers replay every commit since the last checkpoint. Databricks notes that history operations run in parallel but get more expensive as the log grows. If query planning on a hot table feels sluggish, look at commit frequency before you blame the query.
There are a few levers. Batch your writes where the business can live with slightly older data, which is usually more often than they say.
Keep an eye on checkpoint frequency for high-commit tables. And look at V2 checkpoints, which Databricks positions as supporting more concurrent writers and fewer conflicts on large, frequently updated tables. Advice on keeping log size under control mostly comes down to the same habits: fewer, bigger commits, and regular maintenance.
There's also a trap worth naming: two kinds of checkpoint. A Delta log checkpoint snapshots table state. A Structured Streaming checkpoint tracks which source files a query has already processed.
In a real-time monitoring pipeline I built, the checkpoint that caught me out was the streaming one. I fixed the logic in a cell, re-ran it, and nothing happened, because the streaming checkpoint had already marked those files as processed. The delta log was fine the whole time.
Is _delta_log still the source of truth?
For years, the answer was simple: the folder is the table. Any engine that could read _delta_log could work out the latest version.
That's changing. Catalog commits are now generally available for Unity Catalog managed tables. With them, commit coordination moves from the filesystem into the catalog, and the catalog becomes the authority on which version is the latest. The Delta project's write-up on catalog-managed tables says resolving state by replaying the log from storage can add 100+ ms to a query, which is part of the motivation.
What does that mean for debugging? Go through the catalog. Use DESCRIBE HISTORY, Catalog Explorer and table names rather than poking at storage paths. On catalog-managed tables, a folder listing isn't guaranteed to tell the full story about the newest version, and path-based access may not be allowed at all.
Don't get me wrong, I think this is the right direction. Governance through the catalog beats governance by "please don't touch the bucket". But it's one more layer to understand when something breaks. I wouldn't be surprised if "which version is real?" becomes a new class of support question in 2027.
Final thoughts
Three things to take away:
- History first, JSON second.
DESCRIBE HISTORYanswers most "what happened?" questions in one query. Raw commits are for when you need the exact files. - Watch both retention clocks. The delta log remembering a version doesn't mean the data still exists. Set
logRetentionDurationanddeletedFileRetentionDurationdeliberately, and tell your users what time travel can actually reach. - The catalog is the new referee. On Unity Catalog managed tables, debug through the catalog, not the bucket.
If this was useful, I write about this kind of real-world Databricks work every week in The Delta Log. Subscribe for free and get the next one in your inbox.
And I'm curious: what's the strangest thing you've ever found in a delta log? Hit reply and tell me. I read every one.
FAQ
What is the delta log in Databricks?
The delta log is the _delta_log folder inside every Delta table. It holds an ordered series of JSON commit files plus periodic Parquet checkpoints, and together they record every change ever made to the table. Readers rebuild the table's current state by applying those commits in order.
How long does Delta keep table history?
By default, Delta keeps 30 days of history through delta.logRetentionDuration. Data files removed from the table are kept for 7 days through delta.deletedFileRetentionDuration, after which VACUUM can delete them. Time travel only works while both the log entry and the data files still exist.
Can I delete files from _delta_log manually?
You shouldn't. The delta log is the table's source of truth, so deleting or editing commit files can corrupt the table or break time travel. Old log entries are cleaned up automatically once they pass the log retention period, each time a checkpoint is written.
How often does Delta write checkpoints?
Open-source Delta Lake writes a Parquet checkpoint every 10 commits by default, but newer tables on Databricks default to every 100 commits. You can override either with the delta.checkpointInterval table property, and a _last_checkpoint file points readers to the newest checkpoint. Large, frequently updated tables can also use V2 checkpoints, which split the checkpoint into sidecar files.
What's the difference between DESCRIBE HISTORY and time travel?
DESCRIBE HISTORY shows metadata about each version: the operation, the user, the parameters and the row metrics. Time travel, using VERSION AS OF or TIMESTAMP AS OF, actually reads the table's data as it was at that version. History can list versions that time travel can no longer read, once VACUUM has removed their data files.
Downloads
The Python notebook containing the experiments used for this blog post is available for download to our subscribers below. If you don't see it, please subscribe to this newsletter to gain access.
The Python Notebook
How to open it?
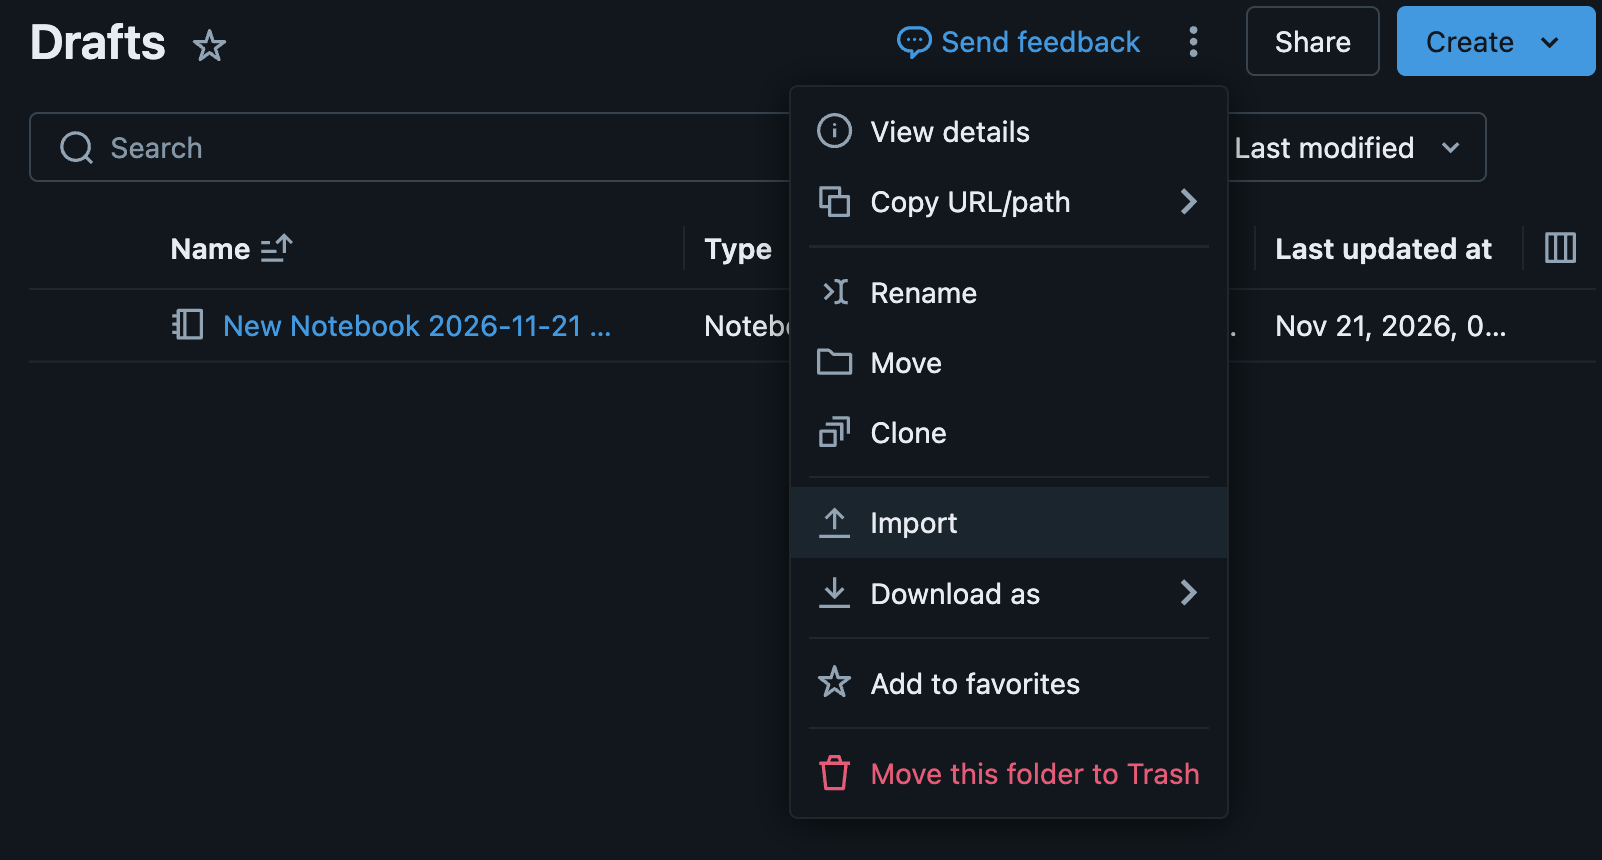
Go to your workspace and use the import option to upload the notebook. Once uploaded, you can click on it to open it. Check the screenshot below.
Thanks as always for reading.
Member discussion